Wedding & Marriage Infographic
After recently getting married, I was amazed at all the traditions that go along with weddings and the stigmas that come with getting married at a young age in America. This got me interested in knowing the evolution of these wedding traditions and the differences between marriage around the world. This infographic project will illustrate my research of these areas as well as my design for displaying this information in an easy to understand way. To see my process, please scroll to the bottom of this page.
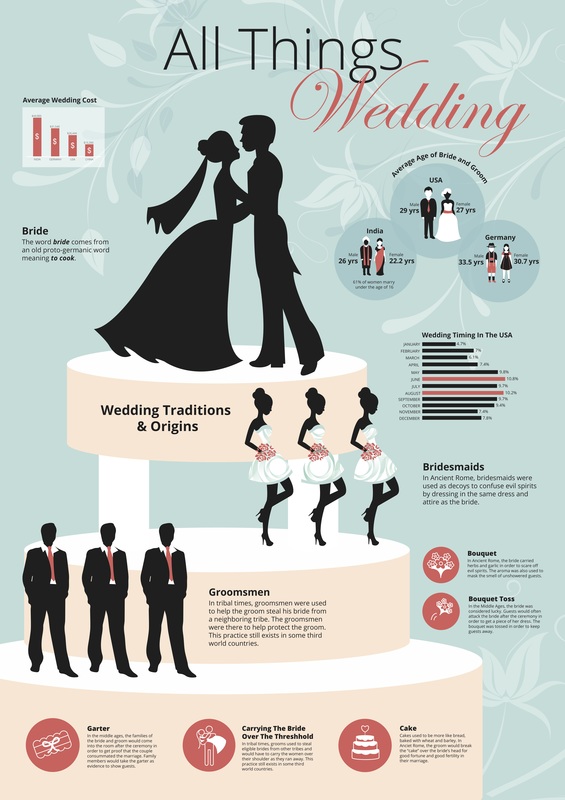
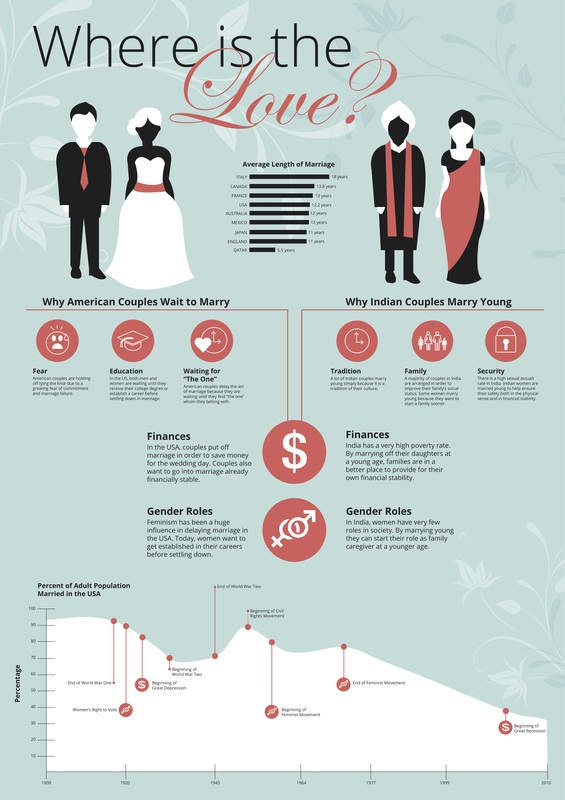
Final Infographics
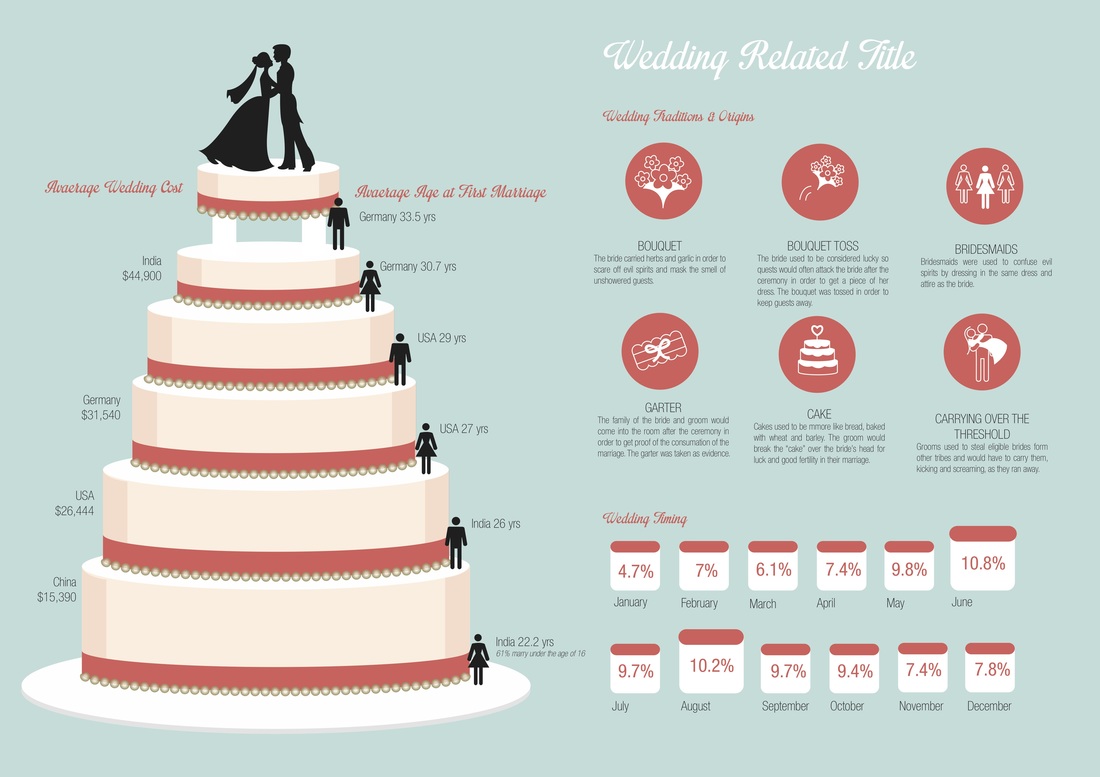
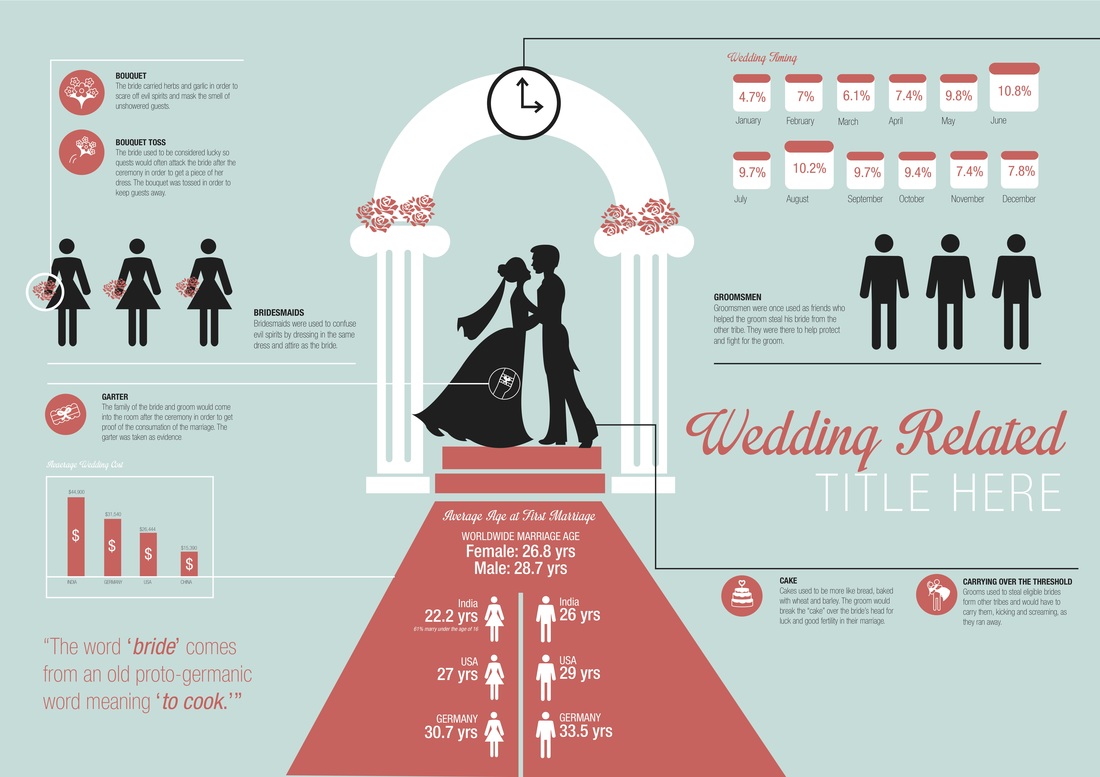
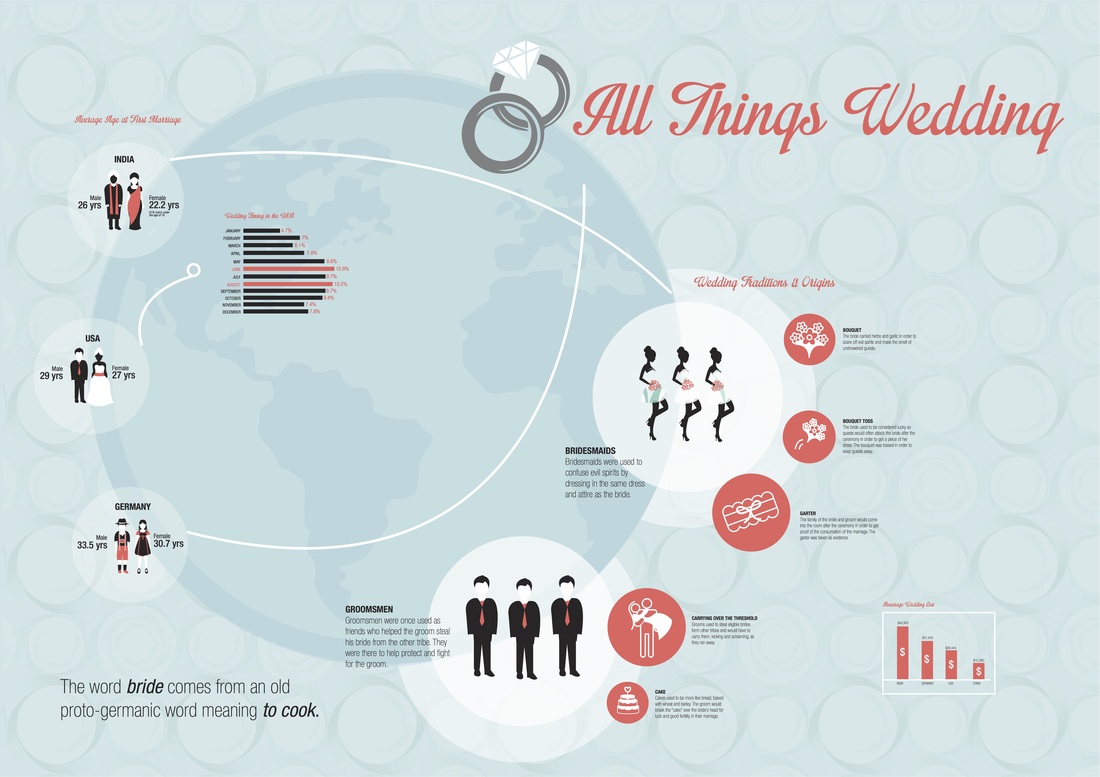
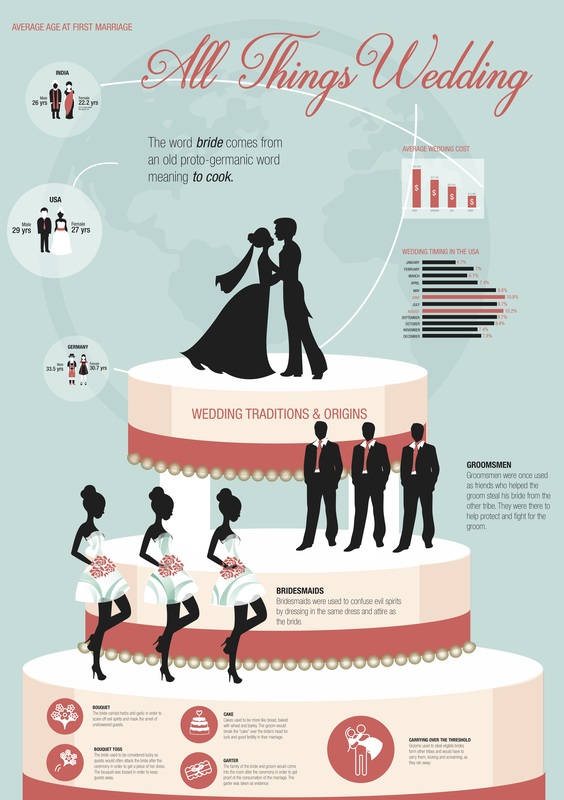
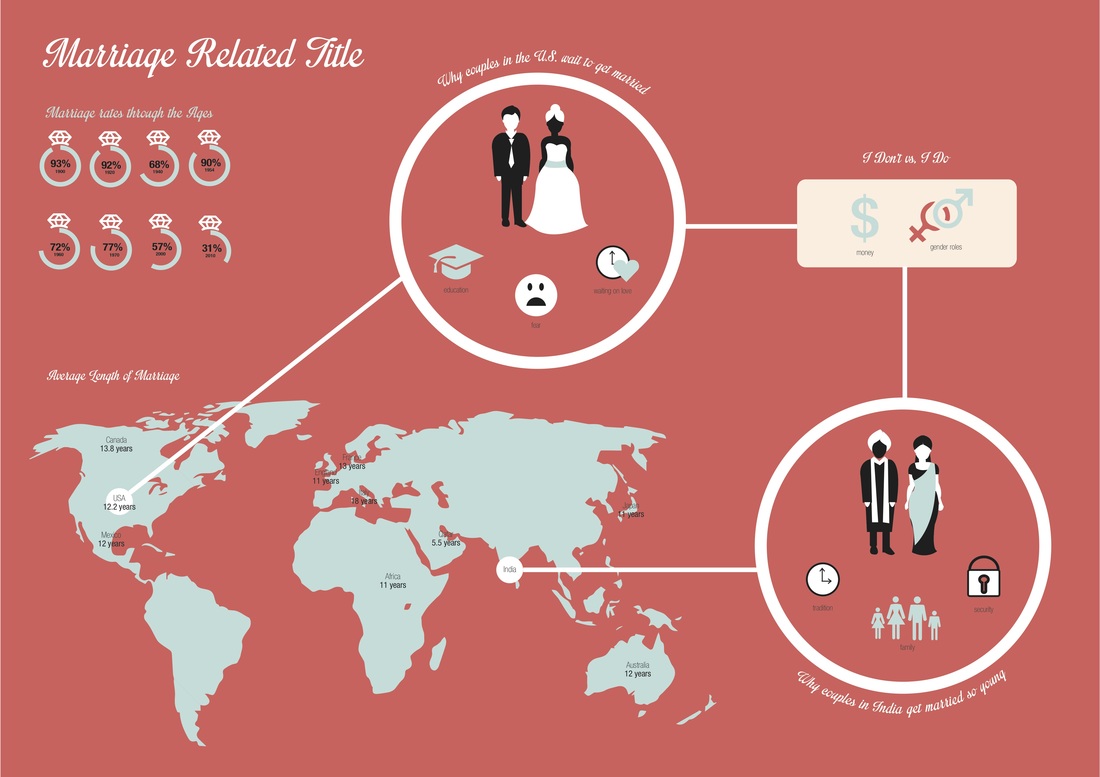
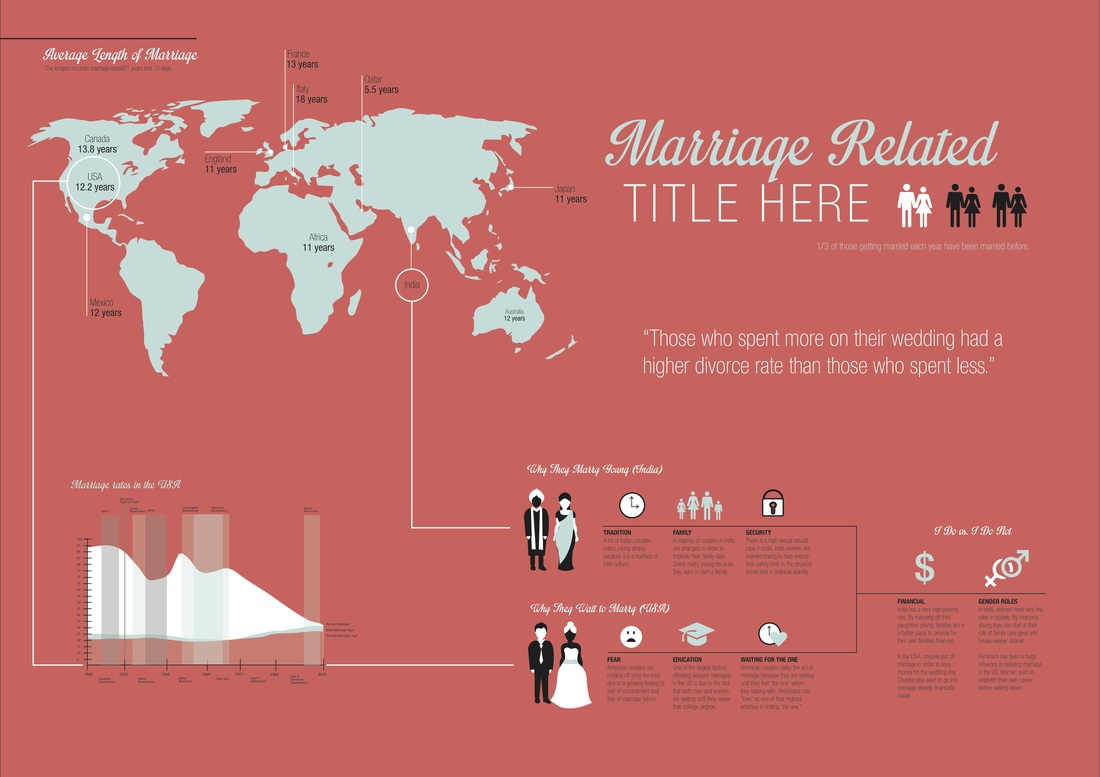
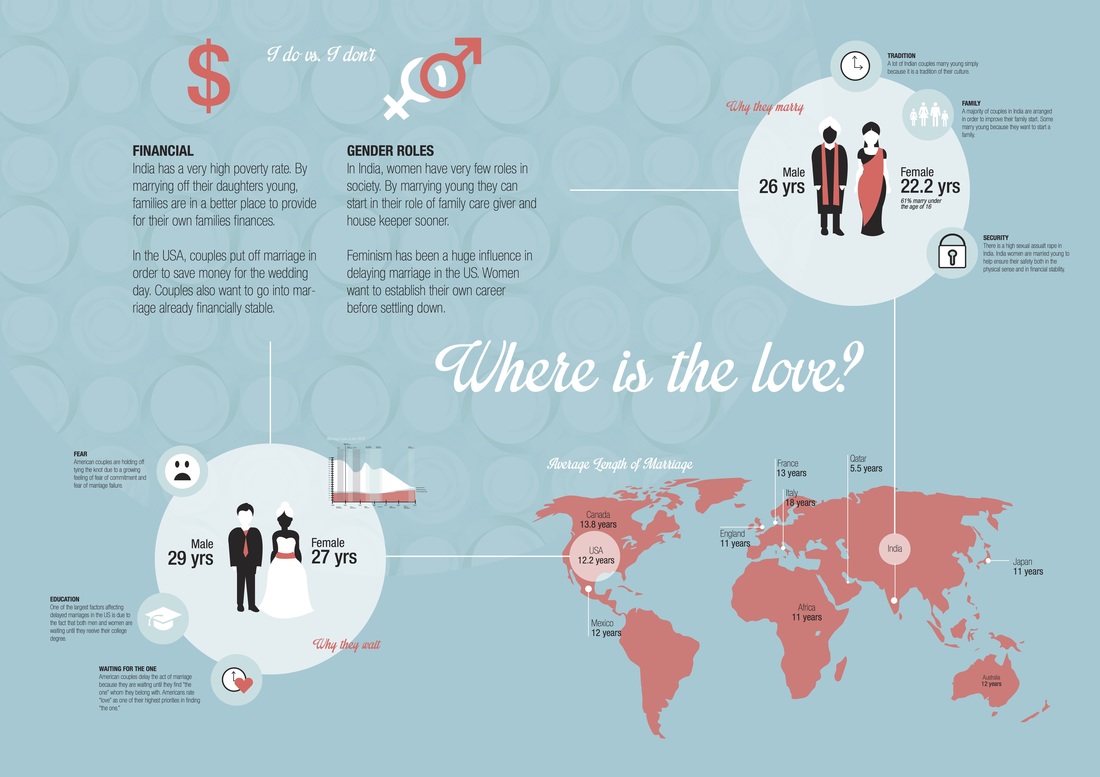
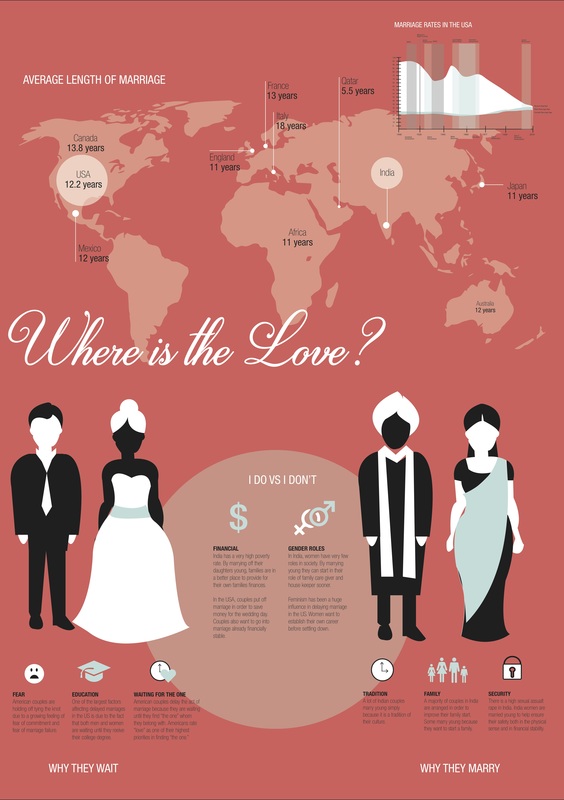
The first board (All Thing Wedding) tells the story of the evolution of weddings and wedding traditions primarily in the US with comparisons to other parts of the world. You will see where our typical "American" wedding traditions originated as well as a what age people have weddings in some countries around the world. The second board (Where is the Love?) tells the story of the differences between American marriage culture, where people are waiting longer to get married, and Indian marriage culture, where people are marrying younger and why those two countries differ. "Where is the Love?" will also show how marriage trends have evolved in the US over time and some of the factors that contributed to these causes that are similar to our reasoning for waiting today.
|
|
Concept Iterations
I went through a variety of iterations in order to get to the final design you see above. The hardest thing for me was taking information that relied so heavily on text and reading and finding a way to display this information in easy to understand visuals. You will see some elements form these iterations that carried through into the finals and some concepts that got left behind but still helped me discover the best way to display the information and tell a story about marriage and weddings.
|
|
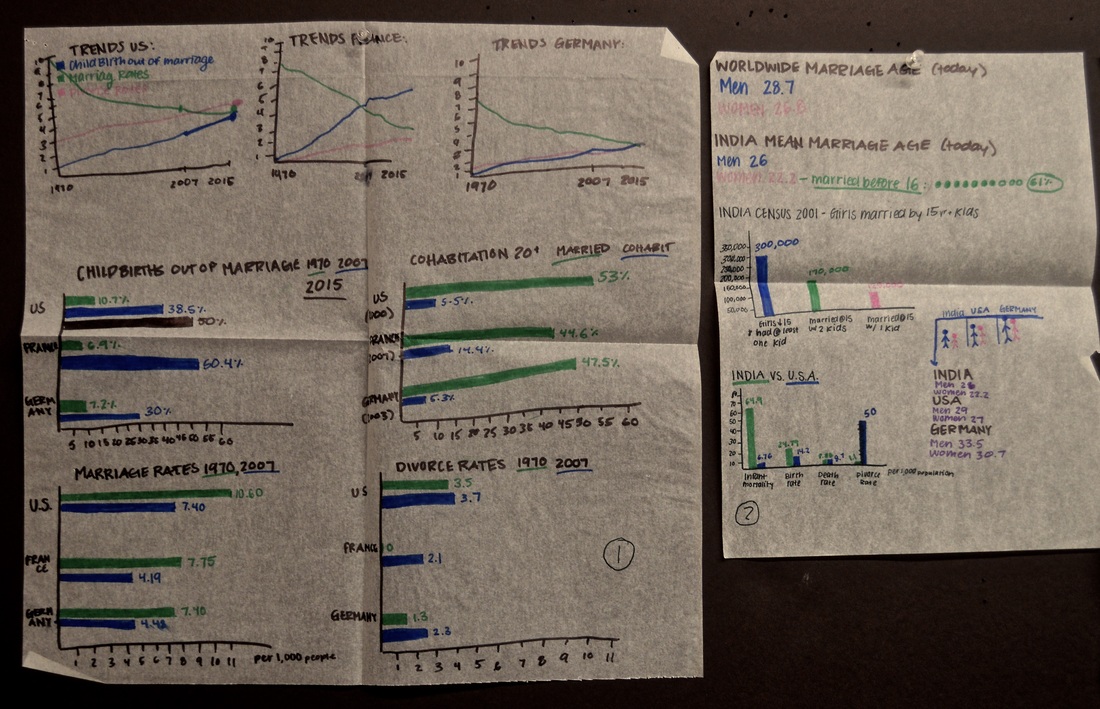
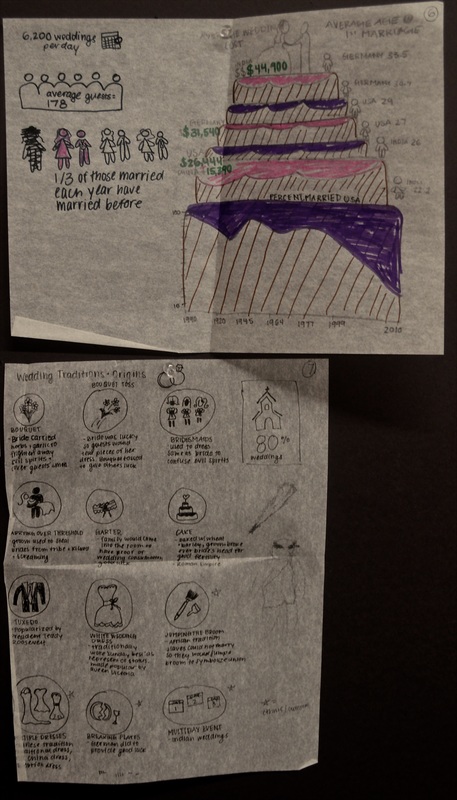
Concept Research & Sketching
At the beginning of my project, I began by researching data around marriage and weddings from different parts of the world. These beginning sketches show my process of taking in data and using different methods of data visualization in order to begin creating infographics. Some of these beginning sketches lead me to the displays you will see in my final design.